

Leaderboard Overview
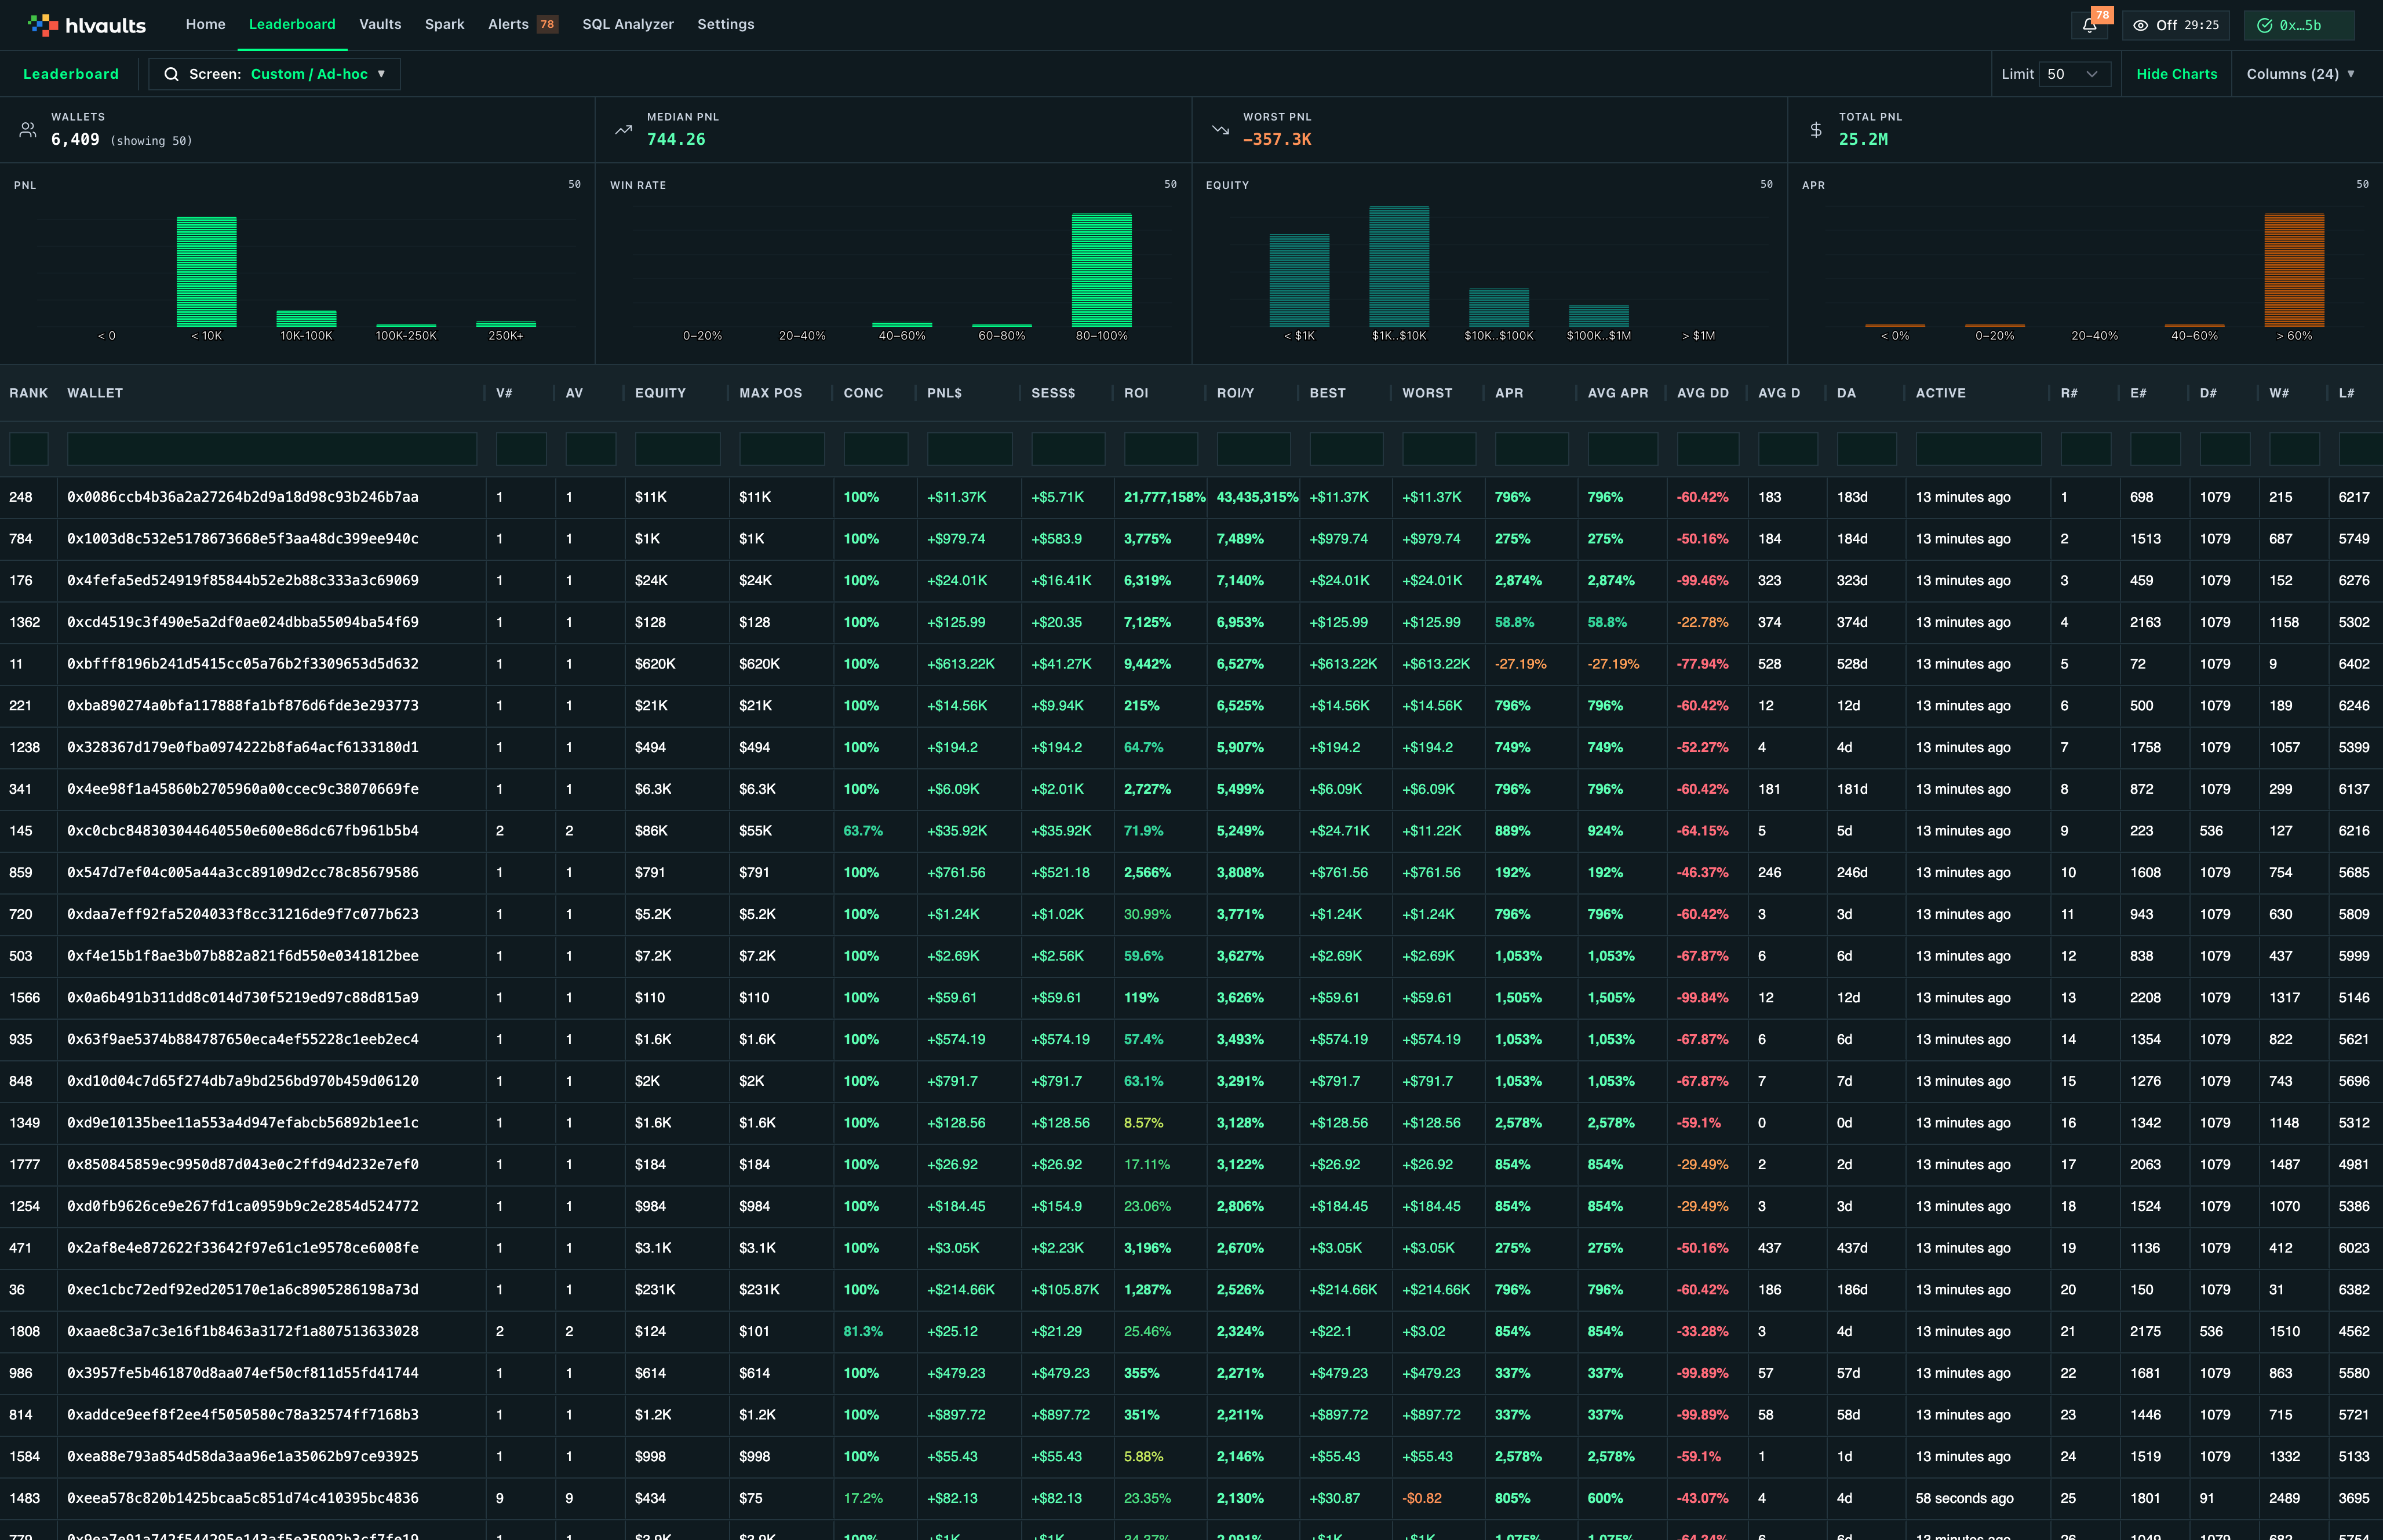
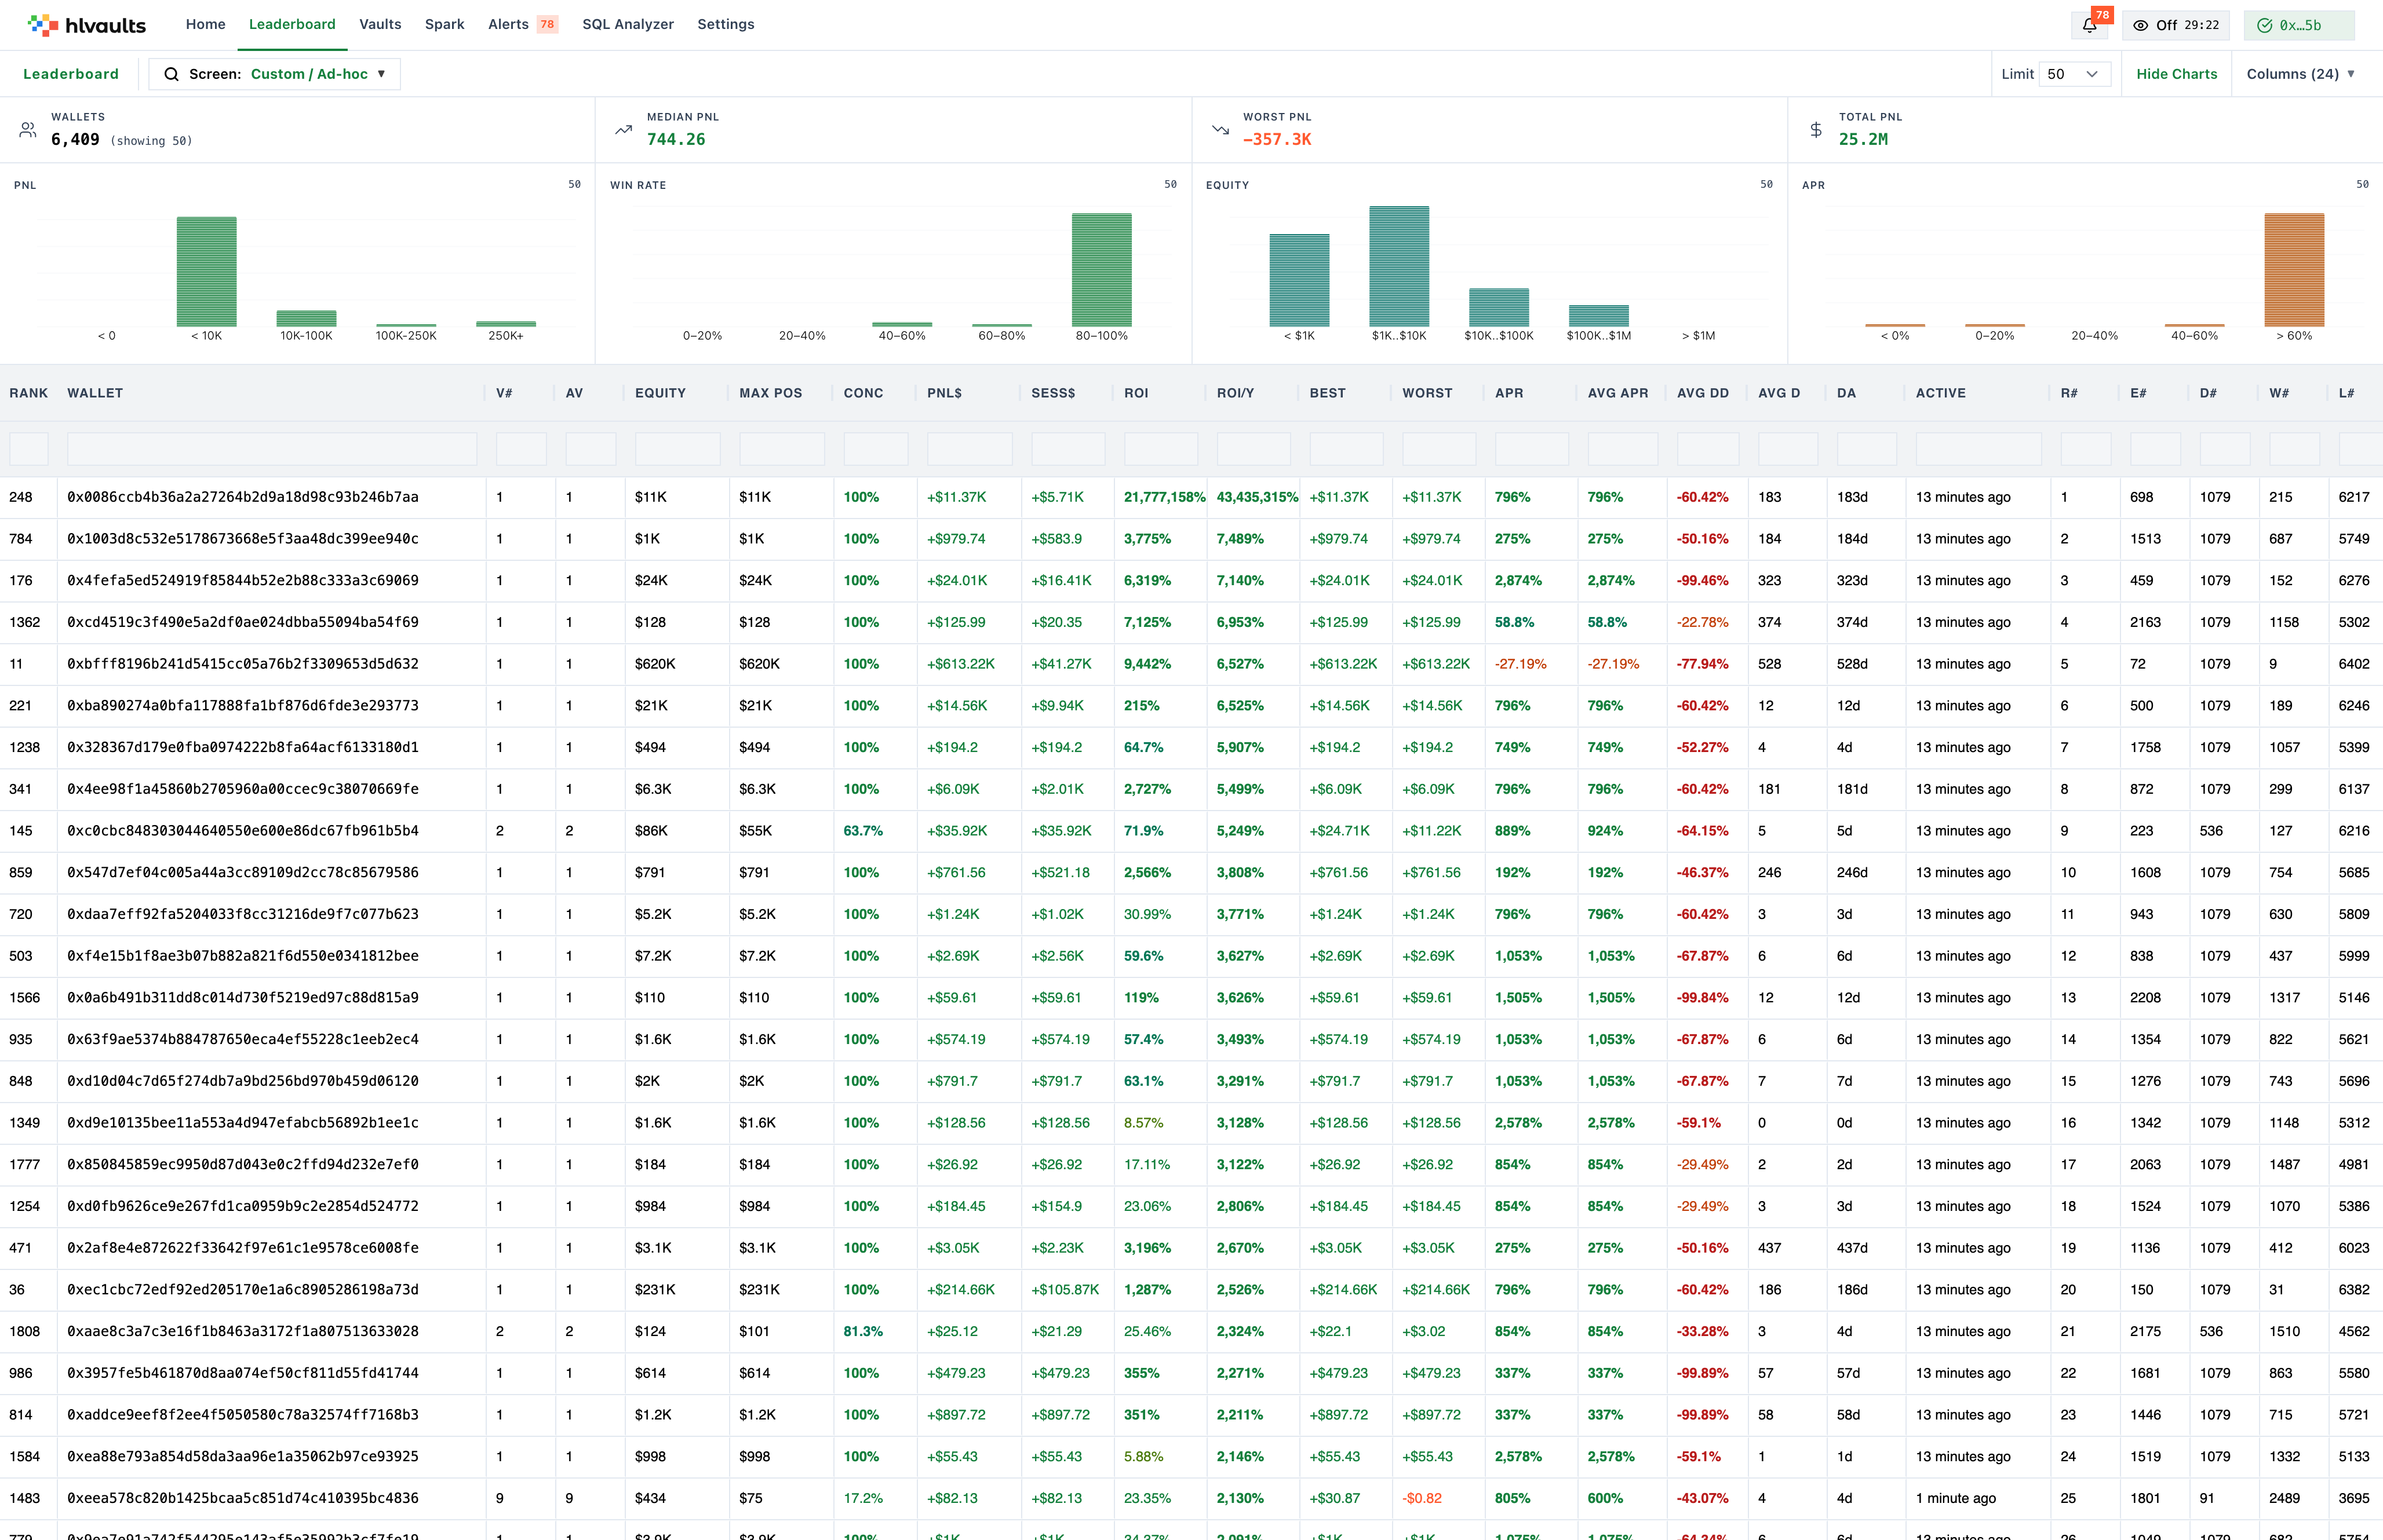
The leaderboard ranks wallets, not vaults. It aggregates every position a wallet holds across all vaults and ranks them by profit and loss, return on investment, equity, and related metrics. Where the vault grid tells you which vaults to consider, the leaderboard tells you which depositors get the best results — and lets you study what they’re doing.
What makes the leaderboard different from the vault grid?
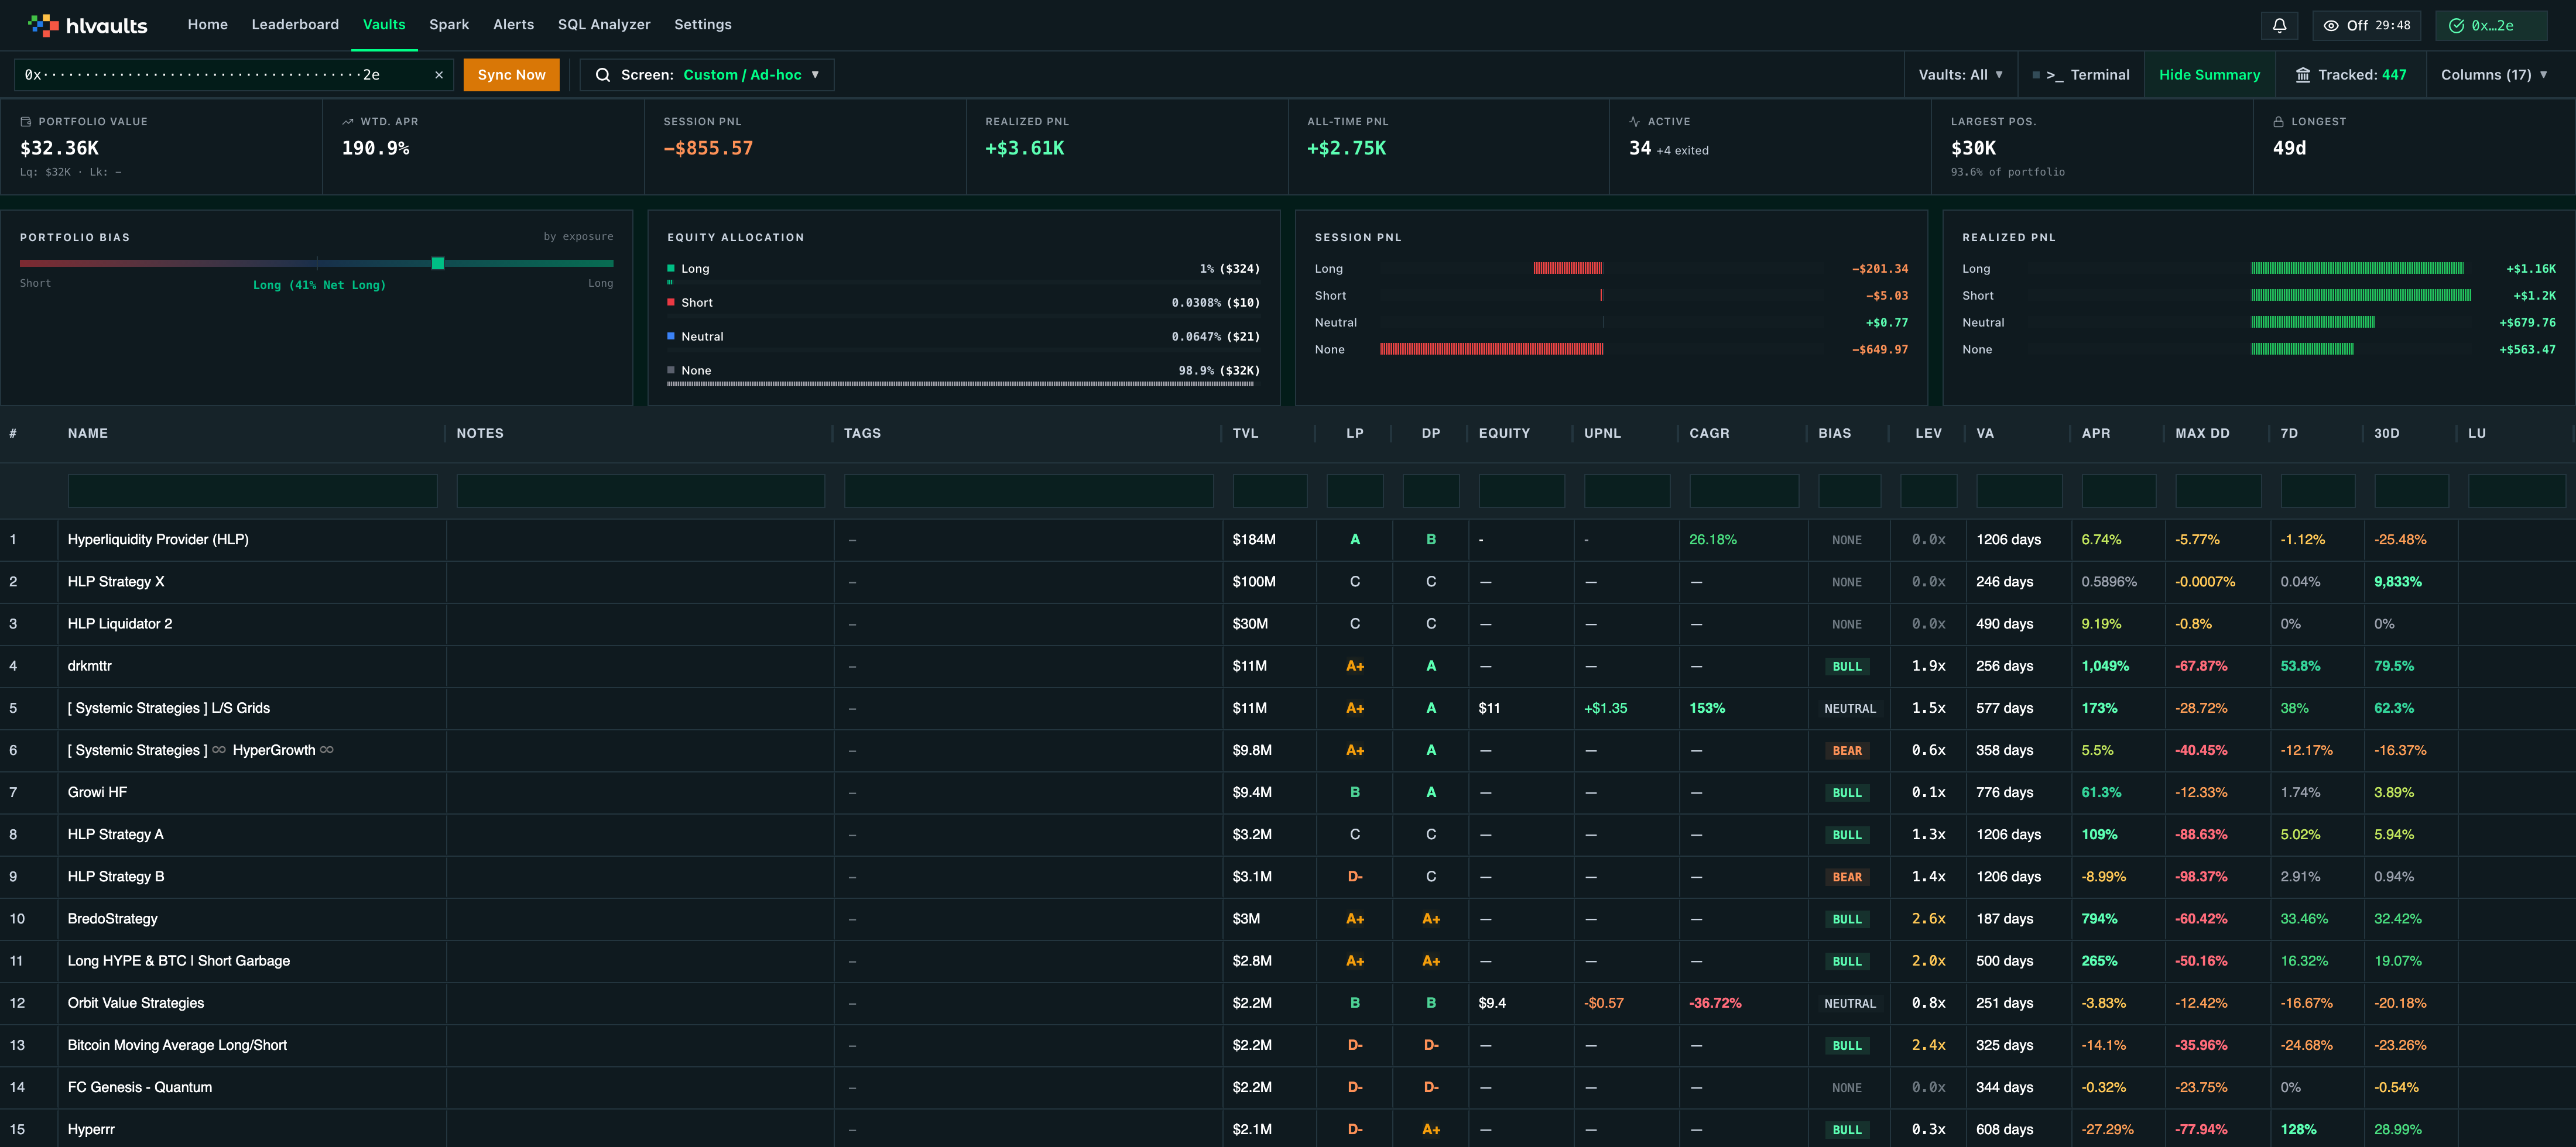
Section titled “What makes the leaderboard different from the vault grid?”The vault grid answers one question: “Which vault should I deposit into?” The leaderboard answers a different one: “Which depositors earn the best returns, and how do they do it?” The vault grid evaluates the vehicle. The leaderboard evaluates the passenger.
Each tool has a role. Use the vault grid when you know what metrics matter to you and want to screen vaults. Use the leaderboard when you want to find skilled depositors, study their portfolios, and discover vaults through their allocation choices.
| Question | Sort by |
|---|---|
| “Who has generated the most profit overall?” | All PnL |
| “Who picks winning vaults most consistently?” | Win % |
| “Who diversifies intelligently across vaults?” | Vaults count |
| “Who achieves the best annualized returns?” | ROI (Ann.) |
| “Which new depositors are off to a strong start?” | First Entry |
| “Who took the biggest loss — and what went wrong?” | Worst PnL |
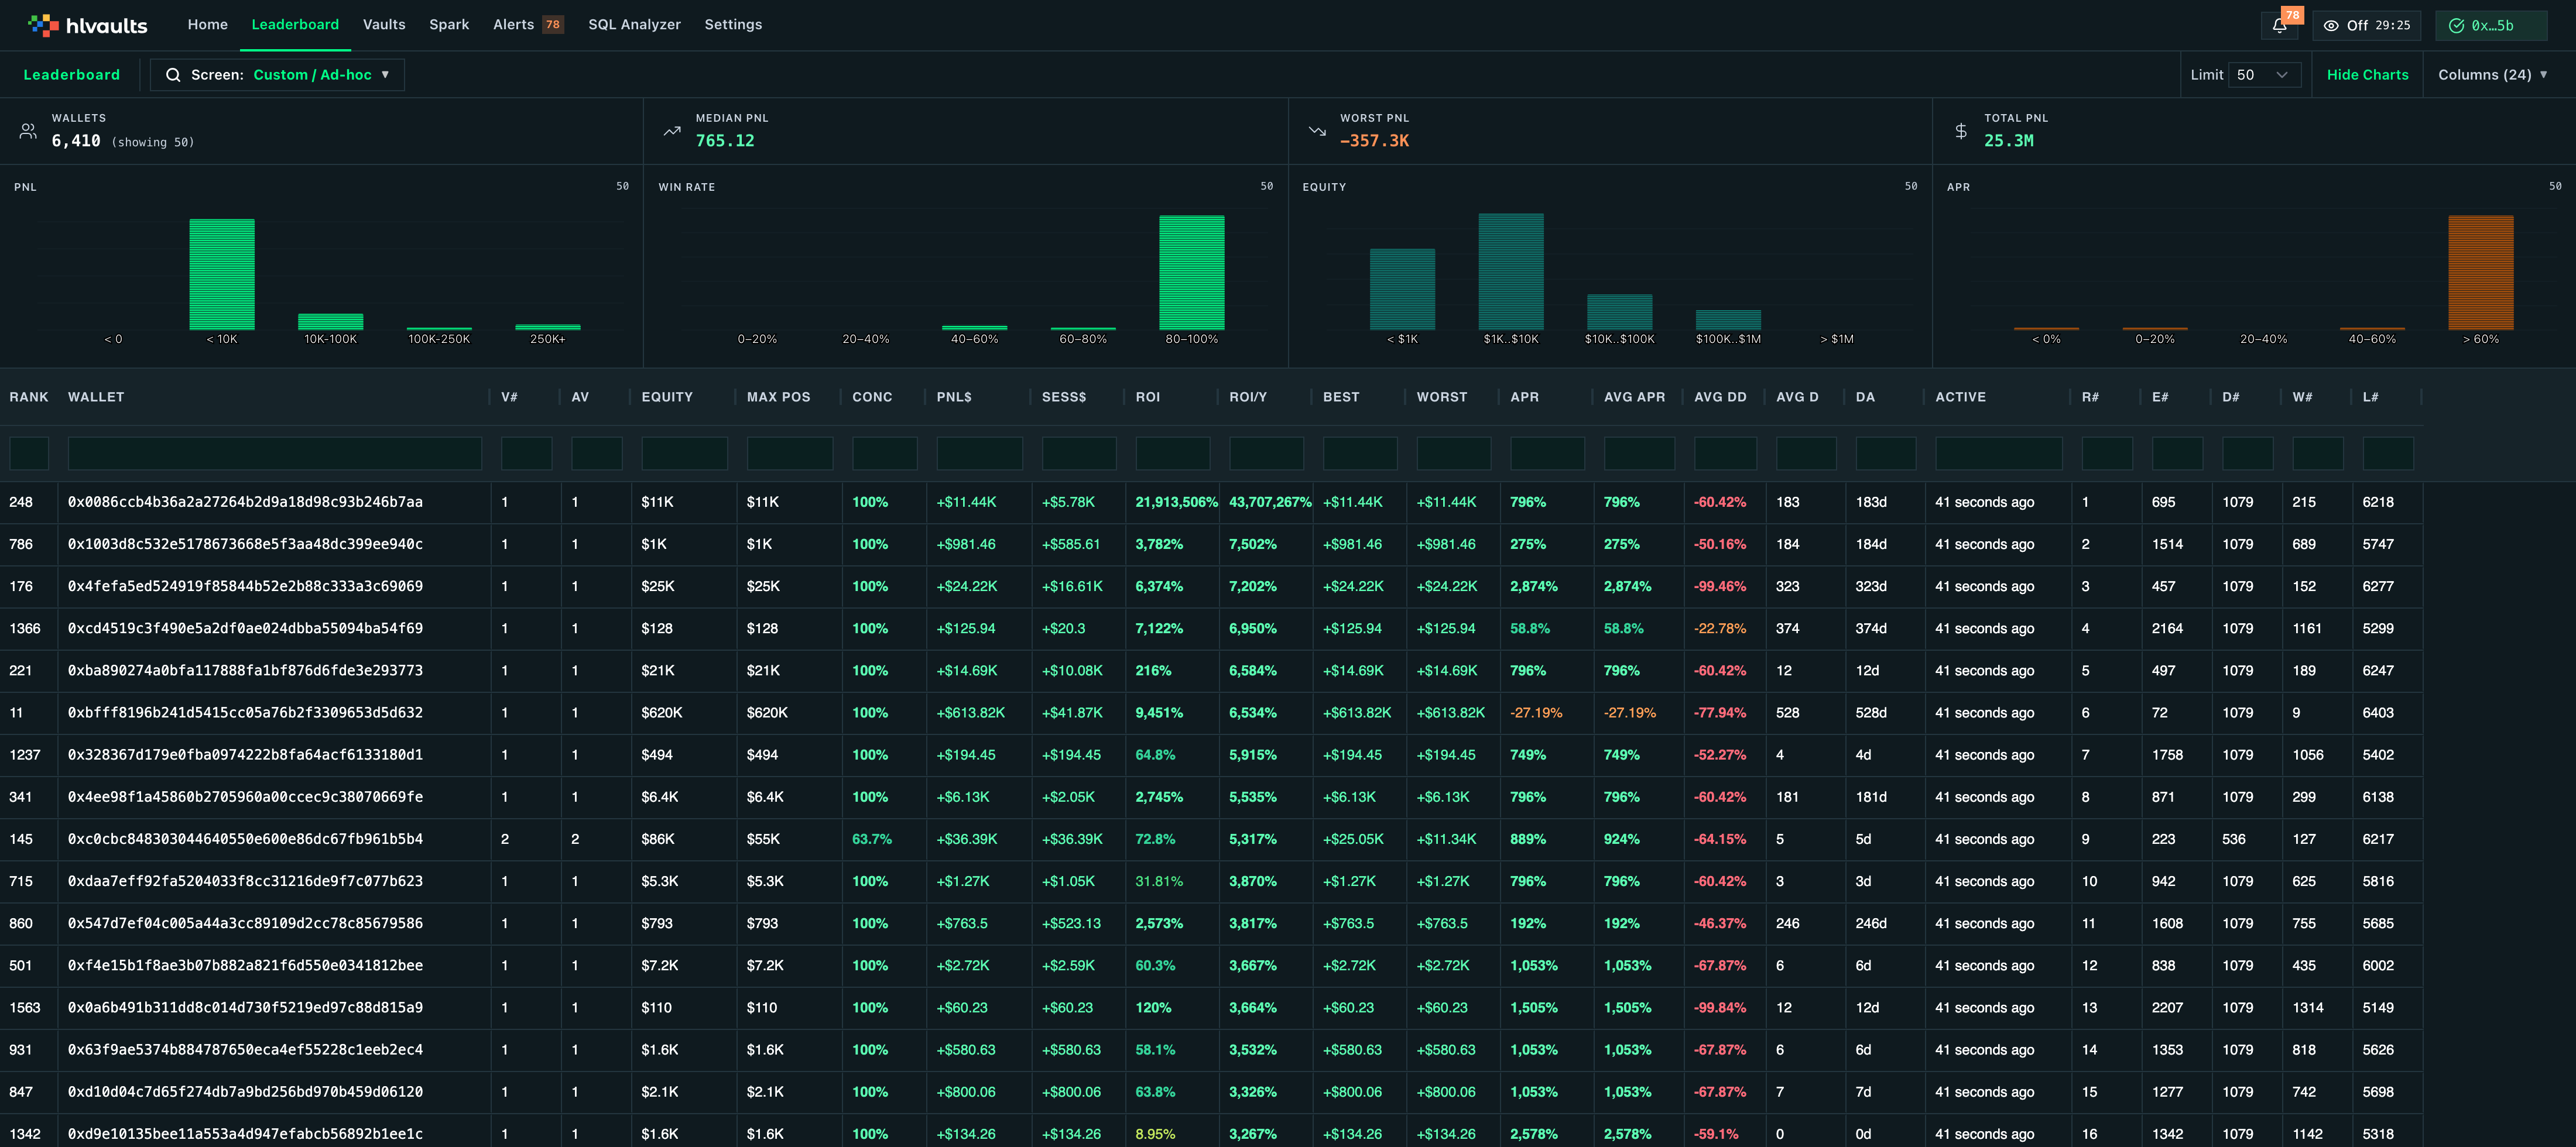
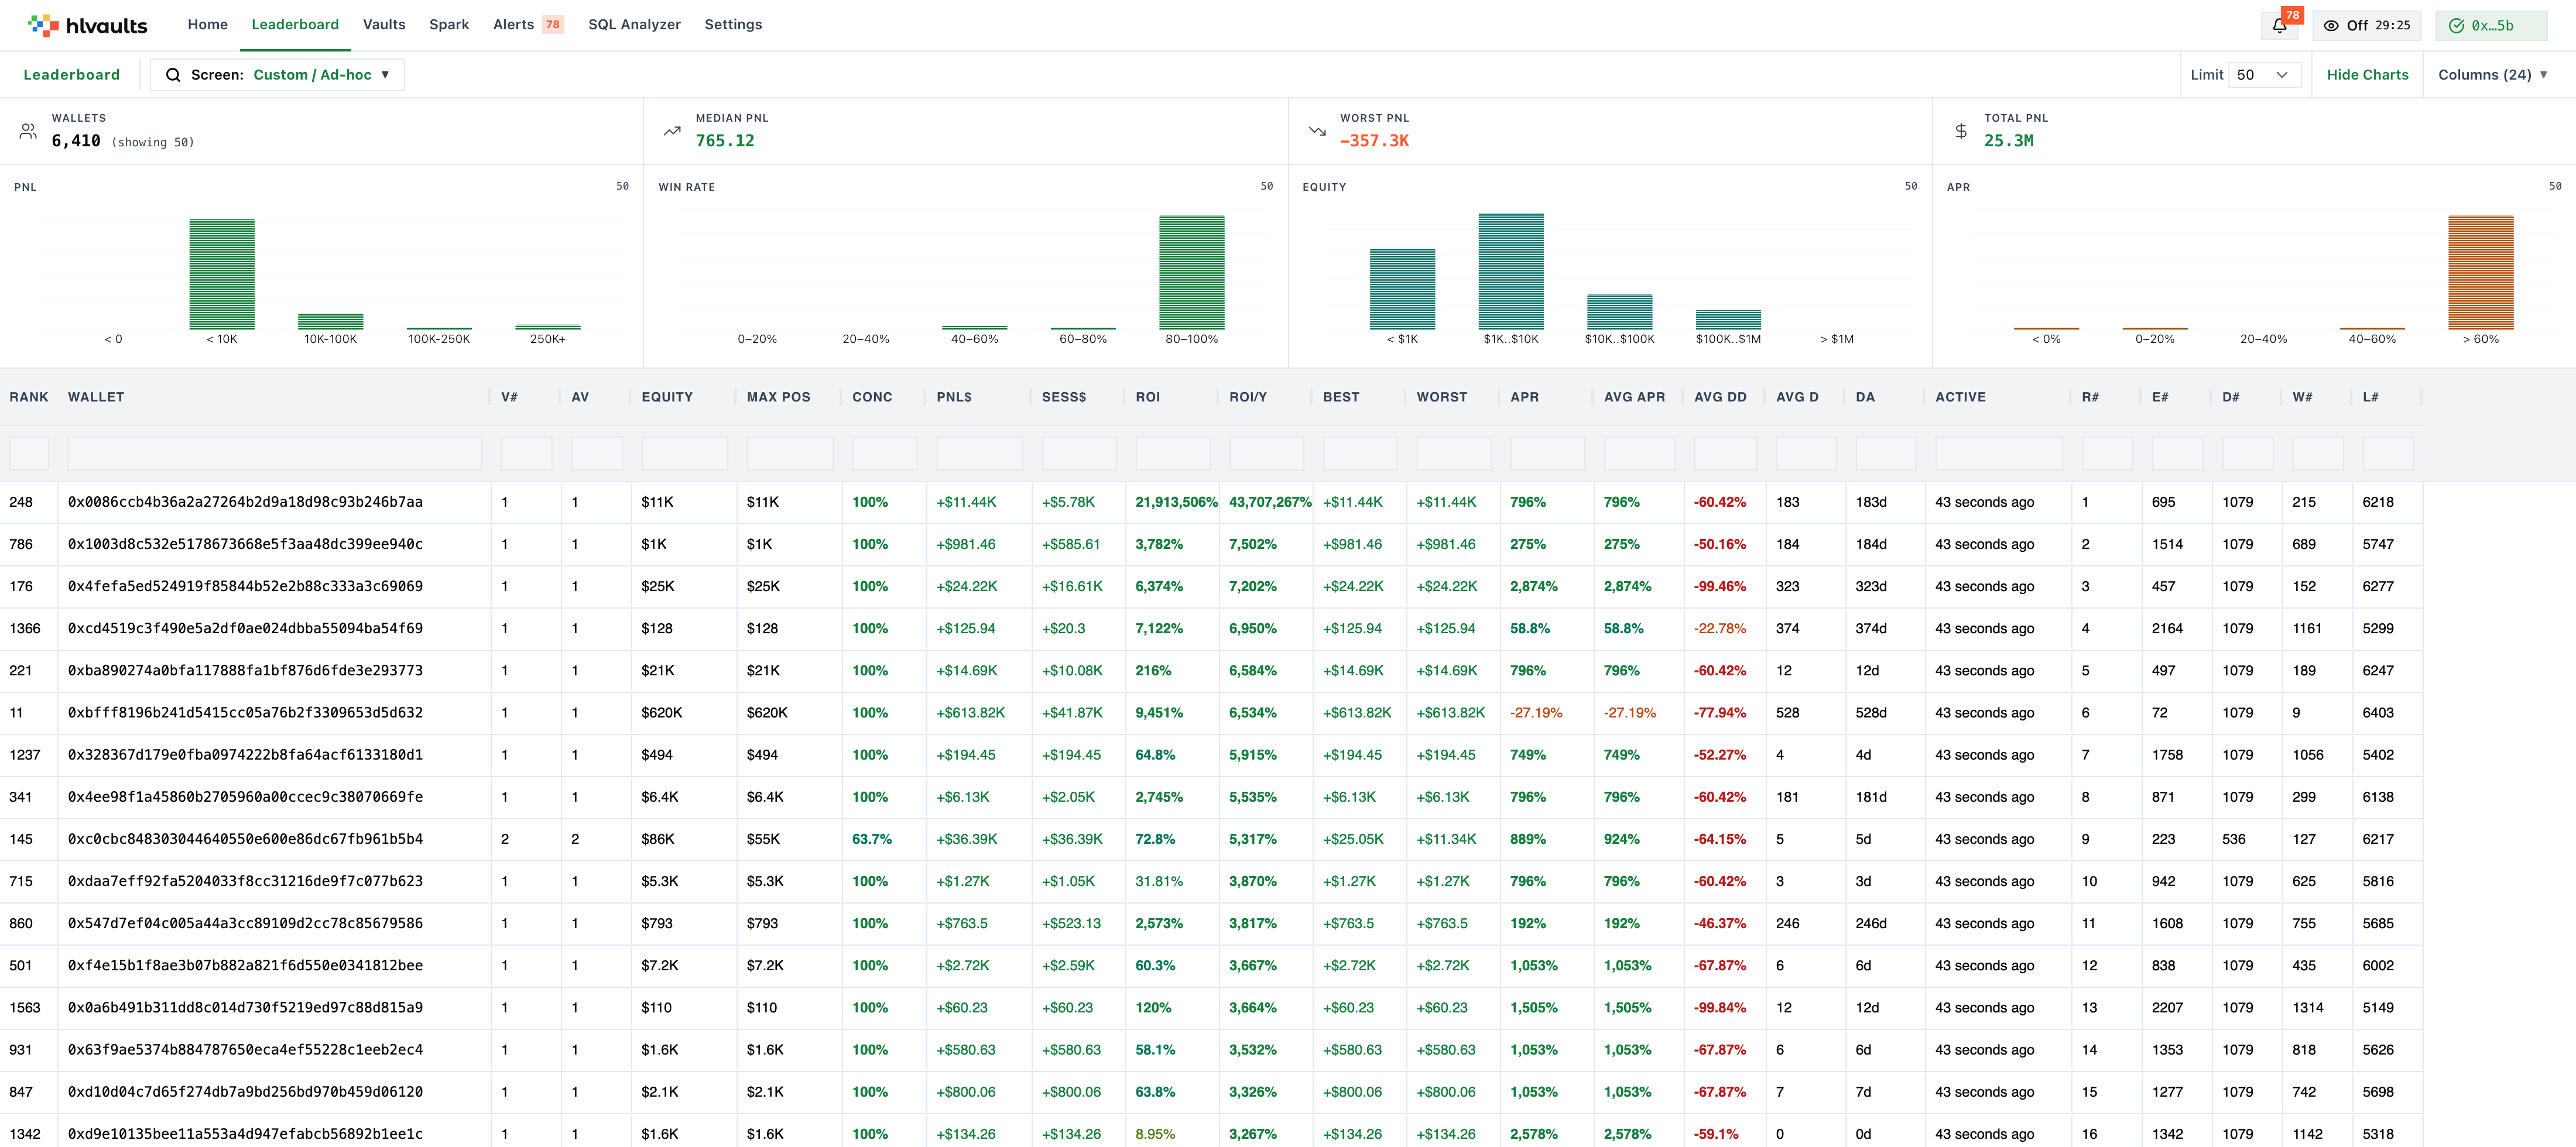
Configure your view
Section titled “Configure your view”Limit the number of wallets
Section titled “Limit the number of wallets”The limit selector controls how many wallets appear in the grid. Your plan determines the maximum:
Free is fixed at the top 5; Growth expands to the top 100; Pro reaches the top 500. The limit exists to keep the grid responsive — most analysis work happens with far fewer wallets anyway.
Toggle the charts strip
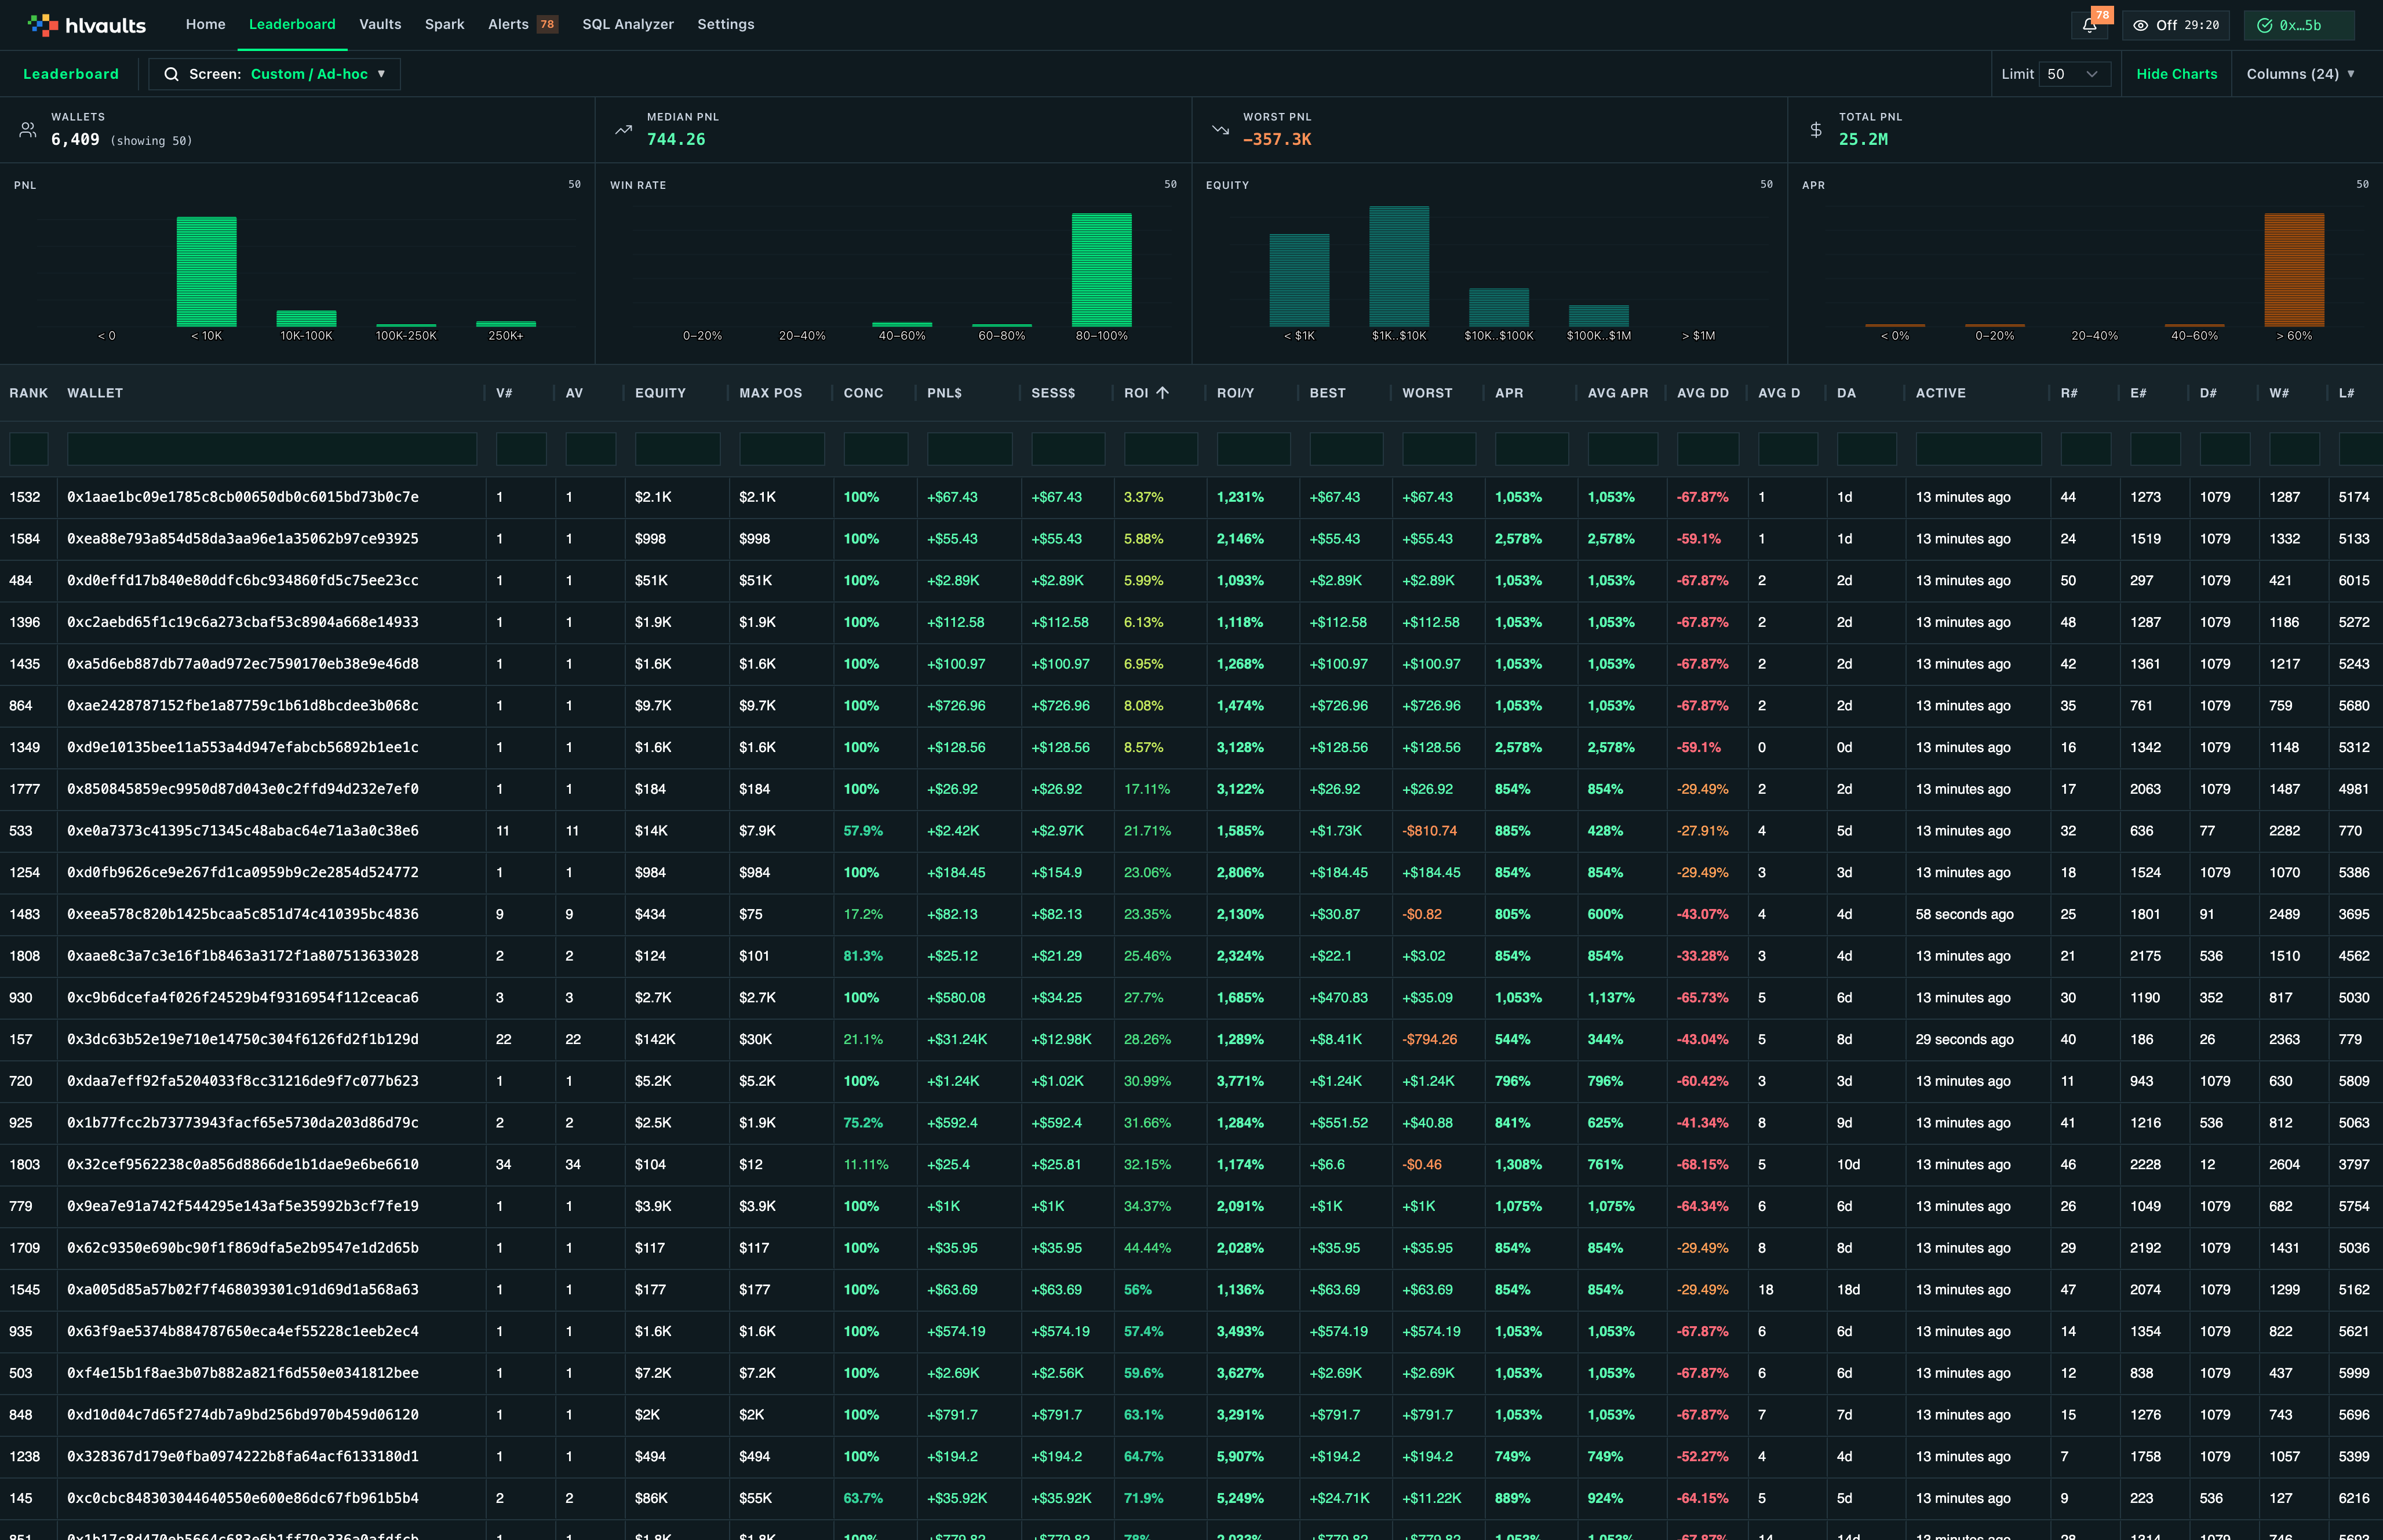
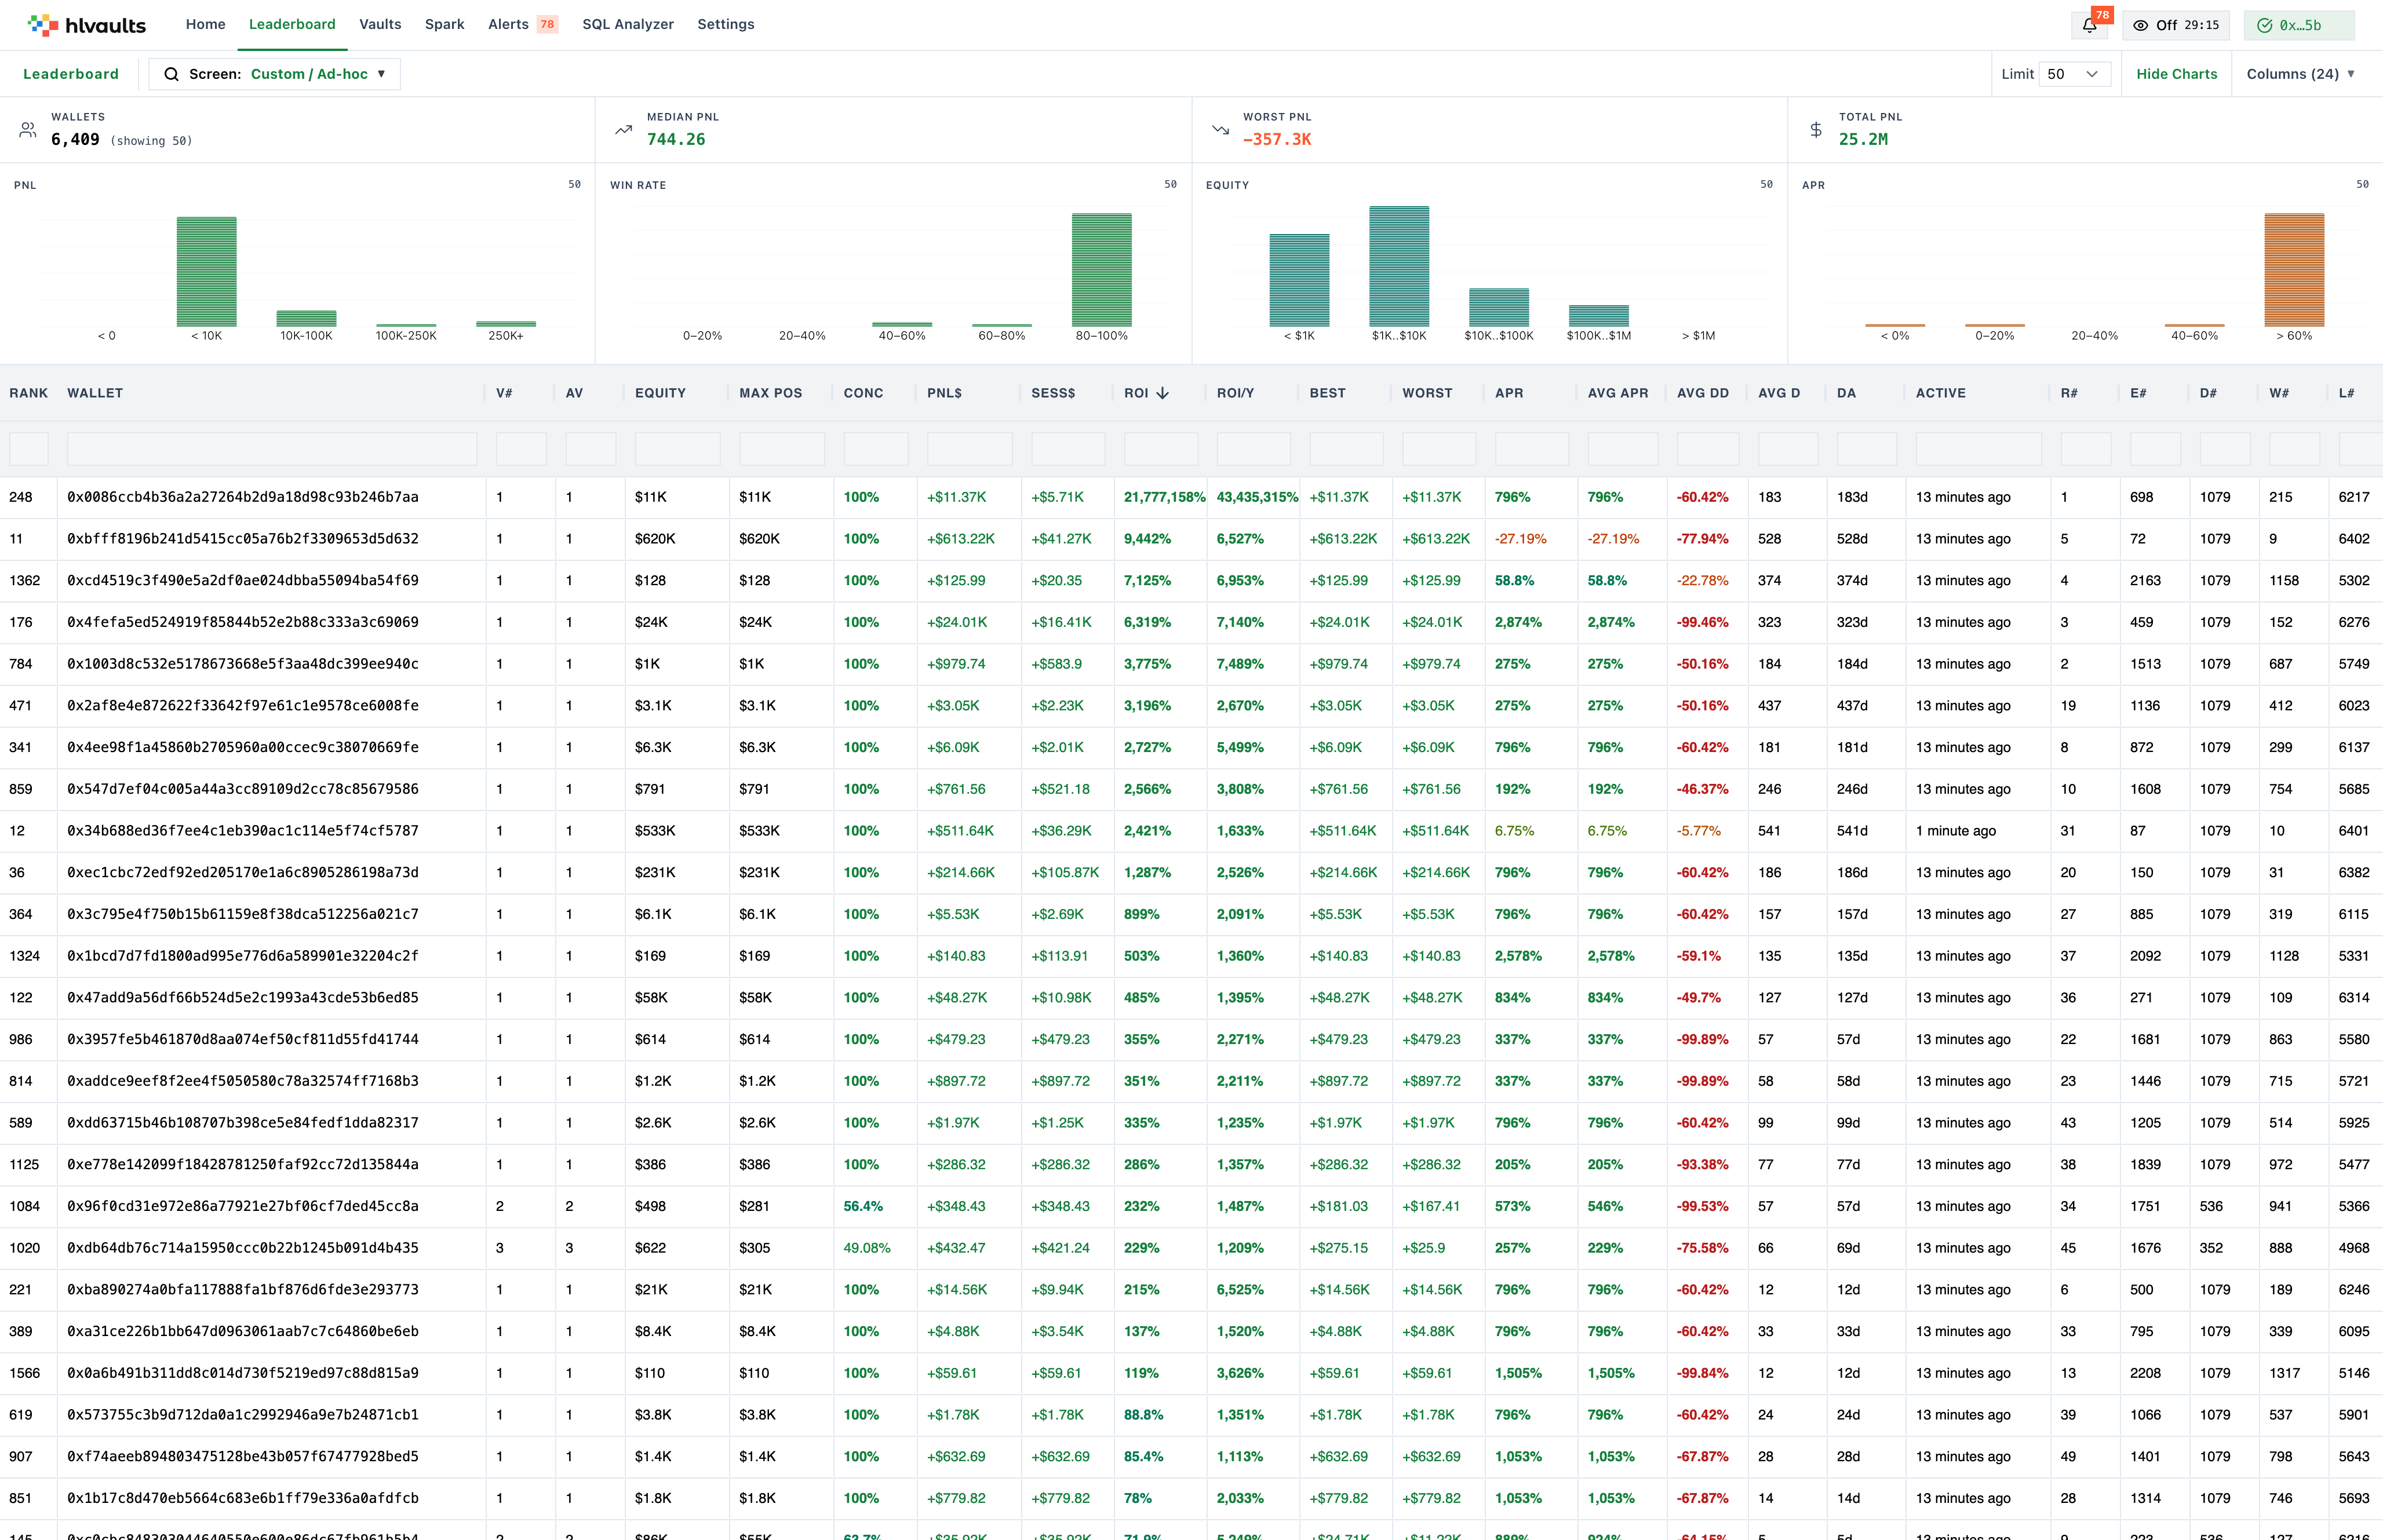
Section titled “Toggle the charts strip”A configurable strip above the grid provides aggregate statistics and distribution views. It contains:
- Stats bar: wallet count, median PnL, worst PnL, total PnL
- Four distribution charts Free
Toggle it on when you need a market-wide perspective. Toggle it off when you want more screen space for individual wallet data.
Show, hide, and save columns
Section titled “Show, hide, and save columns”The columns picker works the same way as the vault grid. Choose which metrics to display and reorder them to match your analysis. Every leaderboard column is available on all plans — the plan only limits how many wallet rows you can load.
Your entire configuration — visible columns, sort order, filters — can be saved as a screen. Free: 1 screen. Growth: up to 100. Pro: unlimited.
Read the charts strip
Section titled “Read the charts strip”Stats bar
Section titled “Stats bar”Four aggregate metrics that summarize the current leaderboard view:








Distribution charts
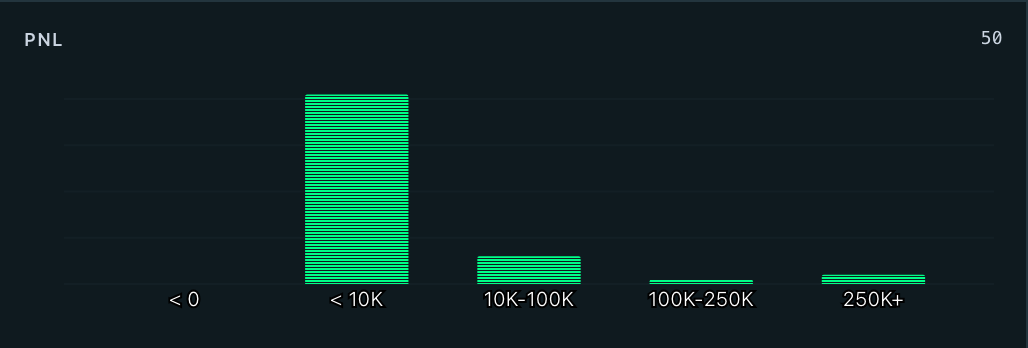
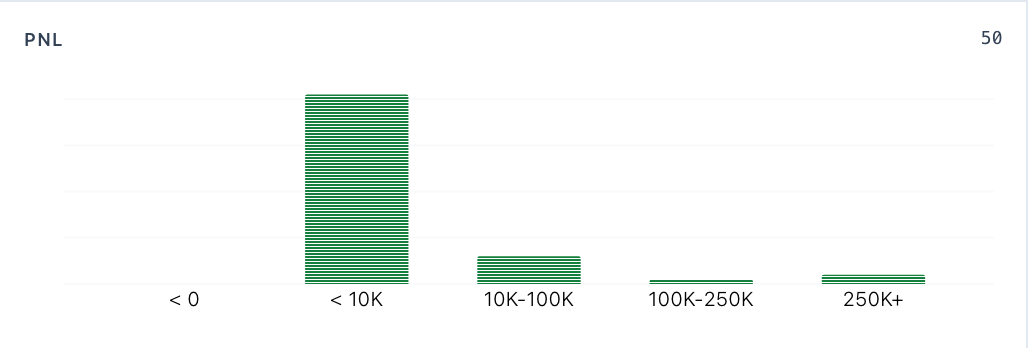
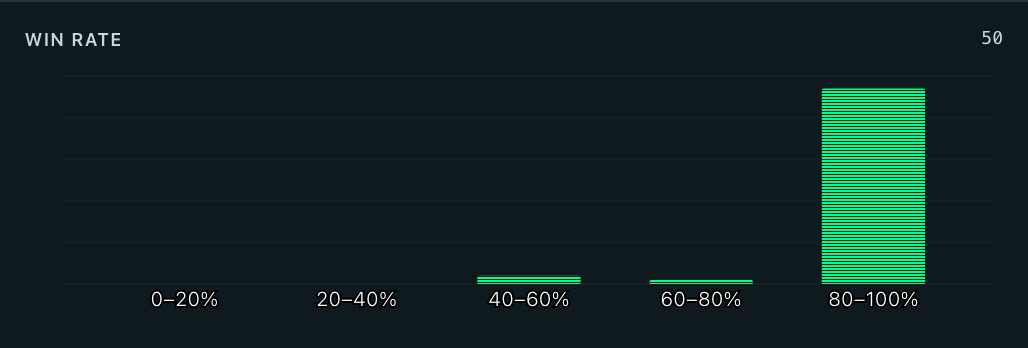
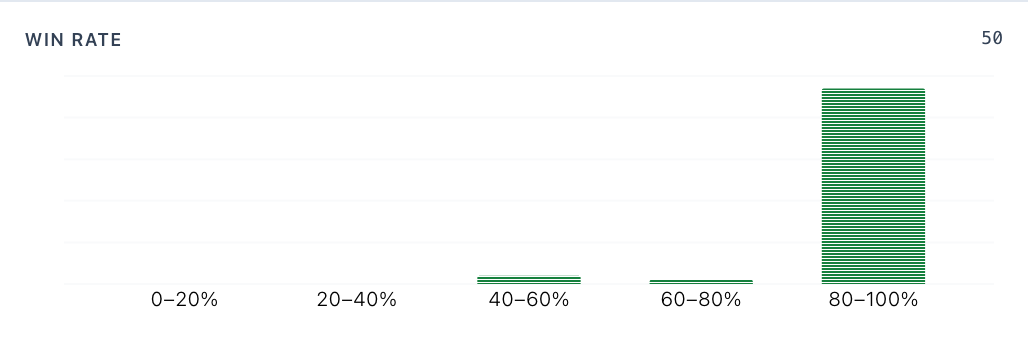
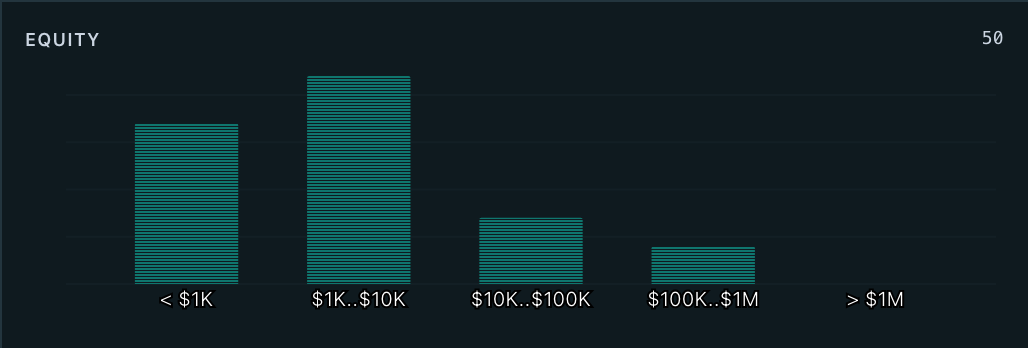
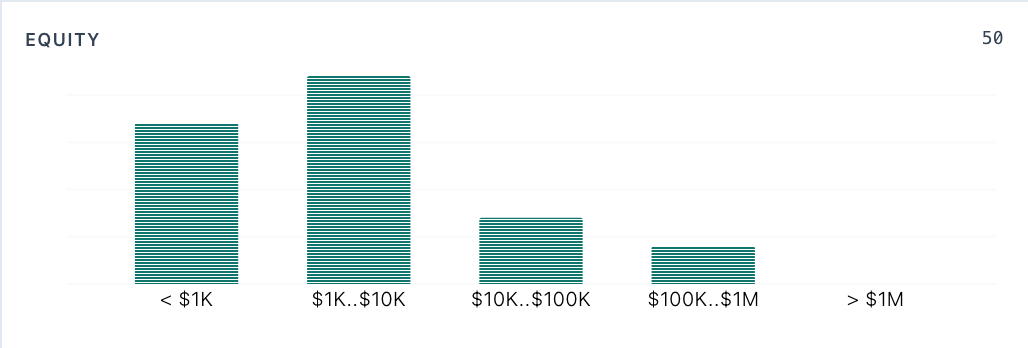
Section titled “Distribution charts”Each chart groups wallets into performance buckets. Together, they give you a sense of where the market stands:
| Chart | Buckets | What to look for |
|---|---|---|
| PnL Distribution | < $0, < $10K, $10K-$100K, $100K-$250K, $250K+ | Are a few wallets capturing most of the gains, or is profit spread broadly? |
| Win Rate Distribution | 0-20%, 20-40%, 40-60%, 60-80%, 80-100% | Are most wallets winning or losing? A cluster toward the left suggests a difficult market. |
| Equity Distribution | < $1K, $1K-$10K, $10K-$100K, $100K-$1M, > $1M | How well-capitalized are the depositors in your view? |
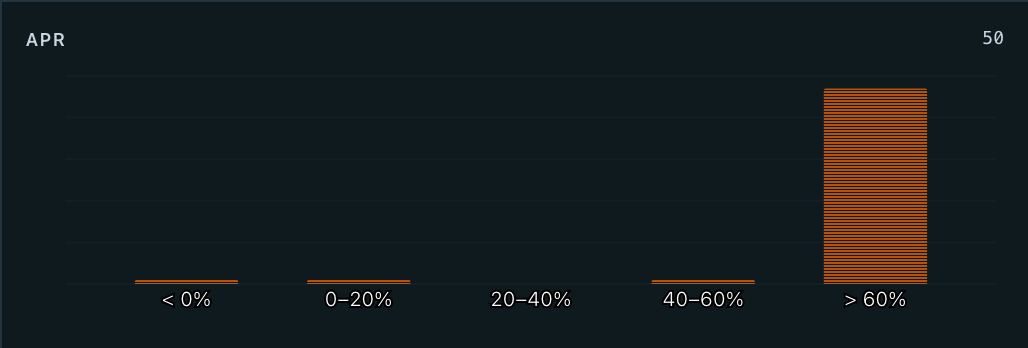
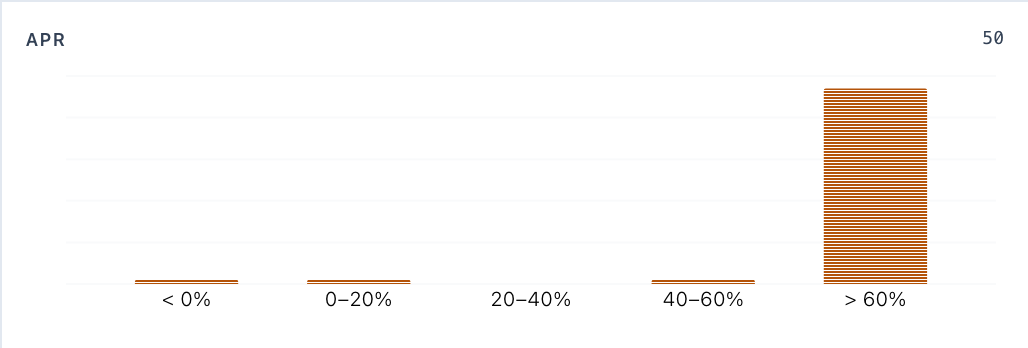
| APR Distribution | < 0%, 0-20%, 20-40%, 40-60%, > 60% | What returns are typical? A wide spread suggests varying skill or risk tolerance. |
Broad distributions — wallets spread across all buckets instead of concentrated in one — suggest a healthy, diverse ecosystem. These charts are available on all plans.
Metric reference
Section titled “Metric reference”PnL metrics
Section titled “PnL metrics”- All PnL — Total profit and loss across every vault this wallet has ever participated in Free
- Session PnL — Current session PnL only Free
- Best PnL / Worst PnL — Best and worst performing single vault positions Free
ROI metrics
Section titled “ROI metrics”- ROI — Simple total return on investment across all vaults Free
- ROI (Ann.) — Annualized return, normalizing for different investment periods Free
Portfolio metrics
Section titled “Portfolio metrics”- Equity — Total current value across all vaults (liquid plus locked) Free
- Concentration — Largest position as a percentage of total equity Free
- Vaults / Active / Exited — How many vaults this wallet has participated in, split by current and past positions Free
Win/Loss metrics
Section titled “Win/Loss metrics”- Win % — Percentage of vault positions that are profitable Free
- Wins / Losses — Count of profitable and unprofitable vault positions Free
Ranking columns
Section titled “Ranking columns”Six ranking columns show where a wallet stands relative to all other wallets:
| Rank | Based on | Plan |
|---|---|---|
| # (Rank) | All-time PnL | Free |
| ROI Rank | Annualized ROI | Free |
| Equity Rank | Total equity | Growth |
| Div. Rank | Number of active vaults | Growth |
| Win Rate Rank | Win rate percentage | Growth |
| Loss Rank | Biggest single loss | Growth |
How to analyze wallets effectively
Section titled “How to analyze wallets effectively”-
Start with annualized ROI. Sort by ROI (Ann.) descending. The wallets at the top consistently pick winning vaults. Study their portfolios to understand what they’re seeing that others miss.
-
Cross-reference with concentration. High ROI means little if a single position drives all the gains. Look for high ROI paired with low concentration — that’s diversified skill, not a lucky bet.
-
Verify with win rate. A wallet with 40% ROI and 90% win rate is compounding steadily. A wallet with 40% ROI and 40% win rate is making big, directional bets. Neither is wrong, but they reflect very different styles.
Click through to the vault grid. Click any wallet address to jump to the vault grid filtered by that wallet Growth. This shows you exactly which vaults they’re in, their allocation sizes, and entry timing.
-
Watch market-wide trends. Toggle the charts on and check the distribution views. When most wallets cluster in the losing buckets, macro conditions may be working against everyone. Context matters when evaluating individual performance.
Related
Section titled “Related”- Leaderboard Columns — every column explained with formulas
- Column Reference — vault grid columns
- Screens & Filters — saving and managing custom views