Summary
The Summary tab is the default view when you open any vault detail page. It serves as a performance dashboard — a single place to gauge the vault’s health before digging deeper.
What does the KPI strip tell you?
Section titled “What does the KPI strip tell you?”Eight key metrics run across the top of the tab. Together they give you a snapshot of size, performance, and risk.
| Metric | What it measures |
|---|---|
| Vault Equity (TVL) | Total value locked — the pool’s size in USD |
| All-Time PnL + ROI % | Lifetime profit or loss, both absolute and relative |
| 24h PnL + ROI % | Performance over the last day |
| 7d PnL + ROI % | Performance over the last week |
| 30d PnL + ROI % | Performance over the last month |
| Current Leverage + Bias | Effective leverage and directional bias (Long/Short/Neutral) |
| Max Drawdown | Largest peak-to-trough decline |
| APR | Annualized return based on recent performance |
Scan the KPI strip first. It answers the surface-level questions: Is this vault profitable? How leveraged is it? Has it experienced large drawdowns? These metrics should guide whether you proceed to the charts and tabs below.


Why use the charts?
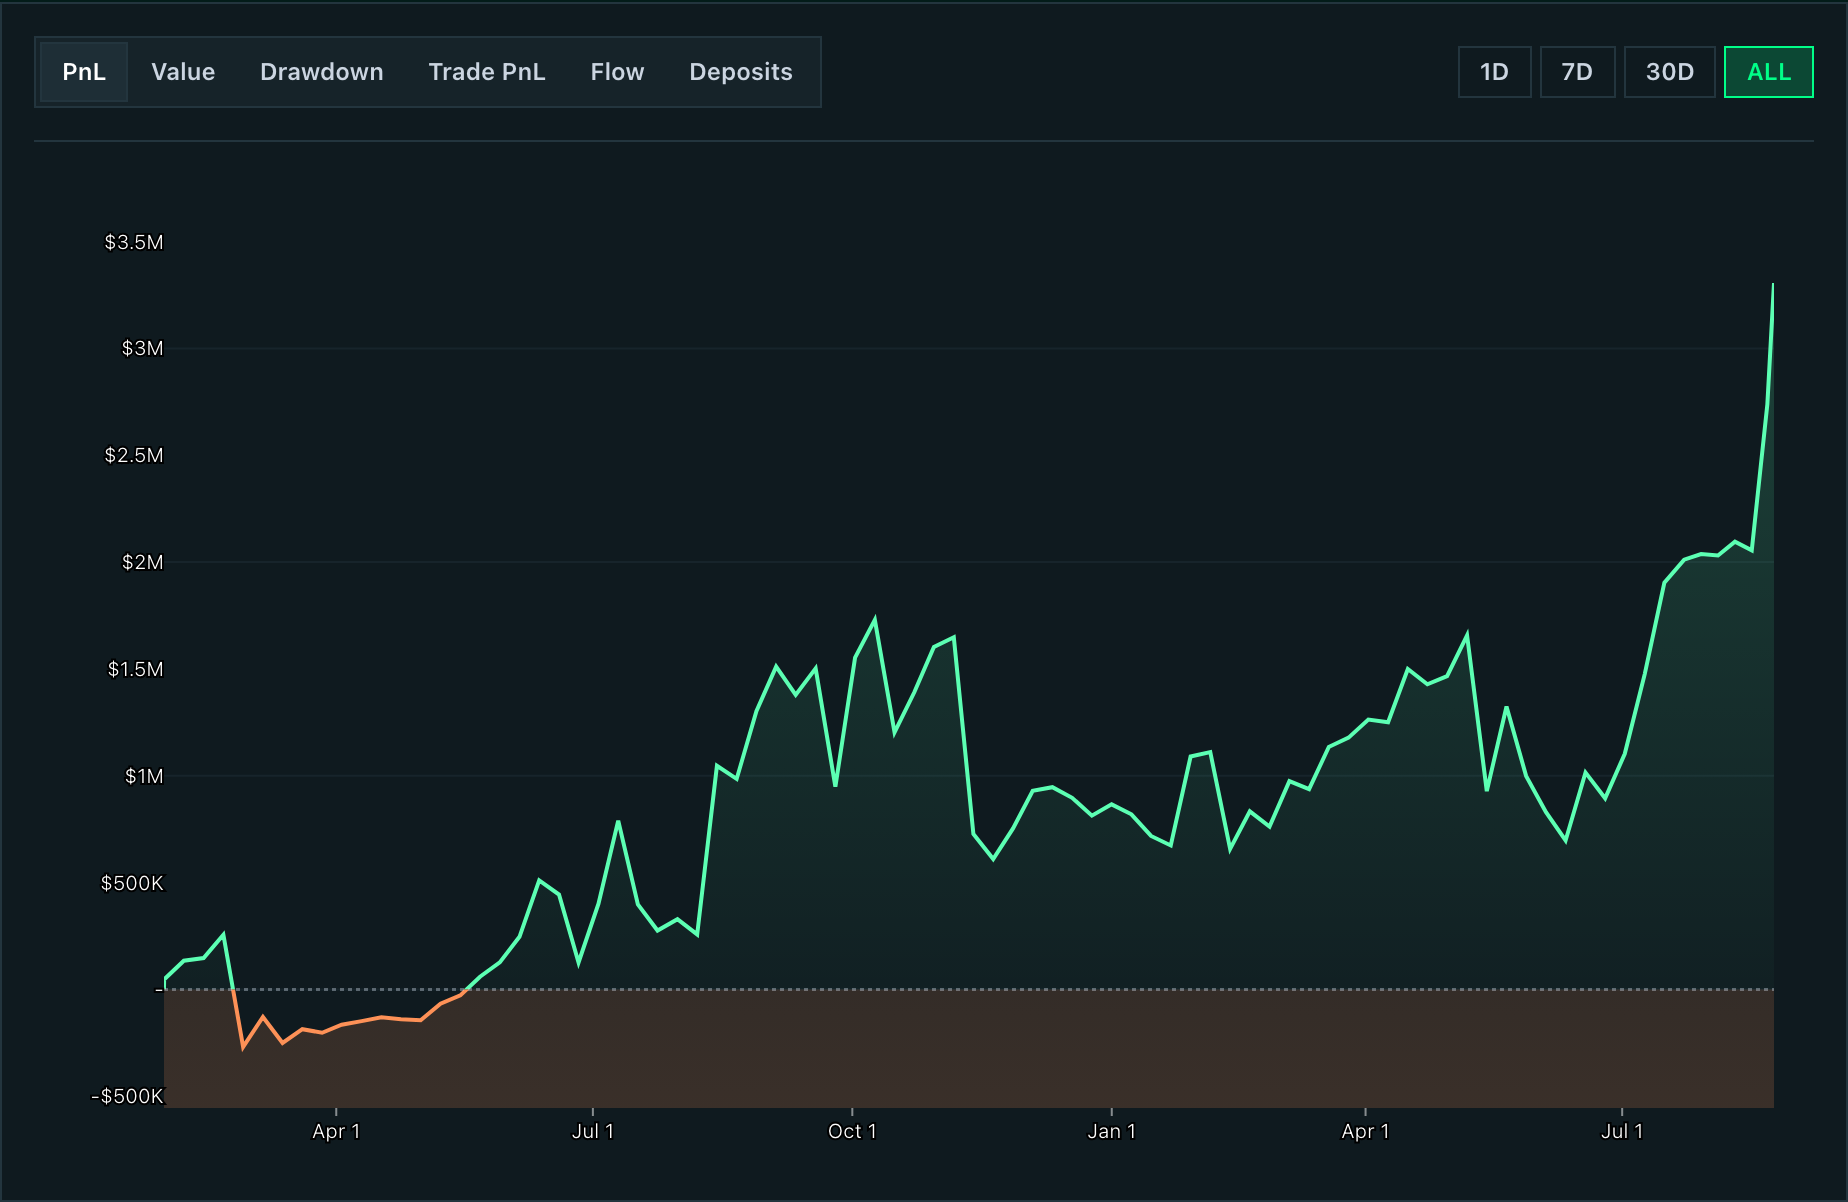
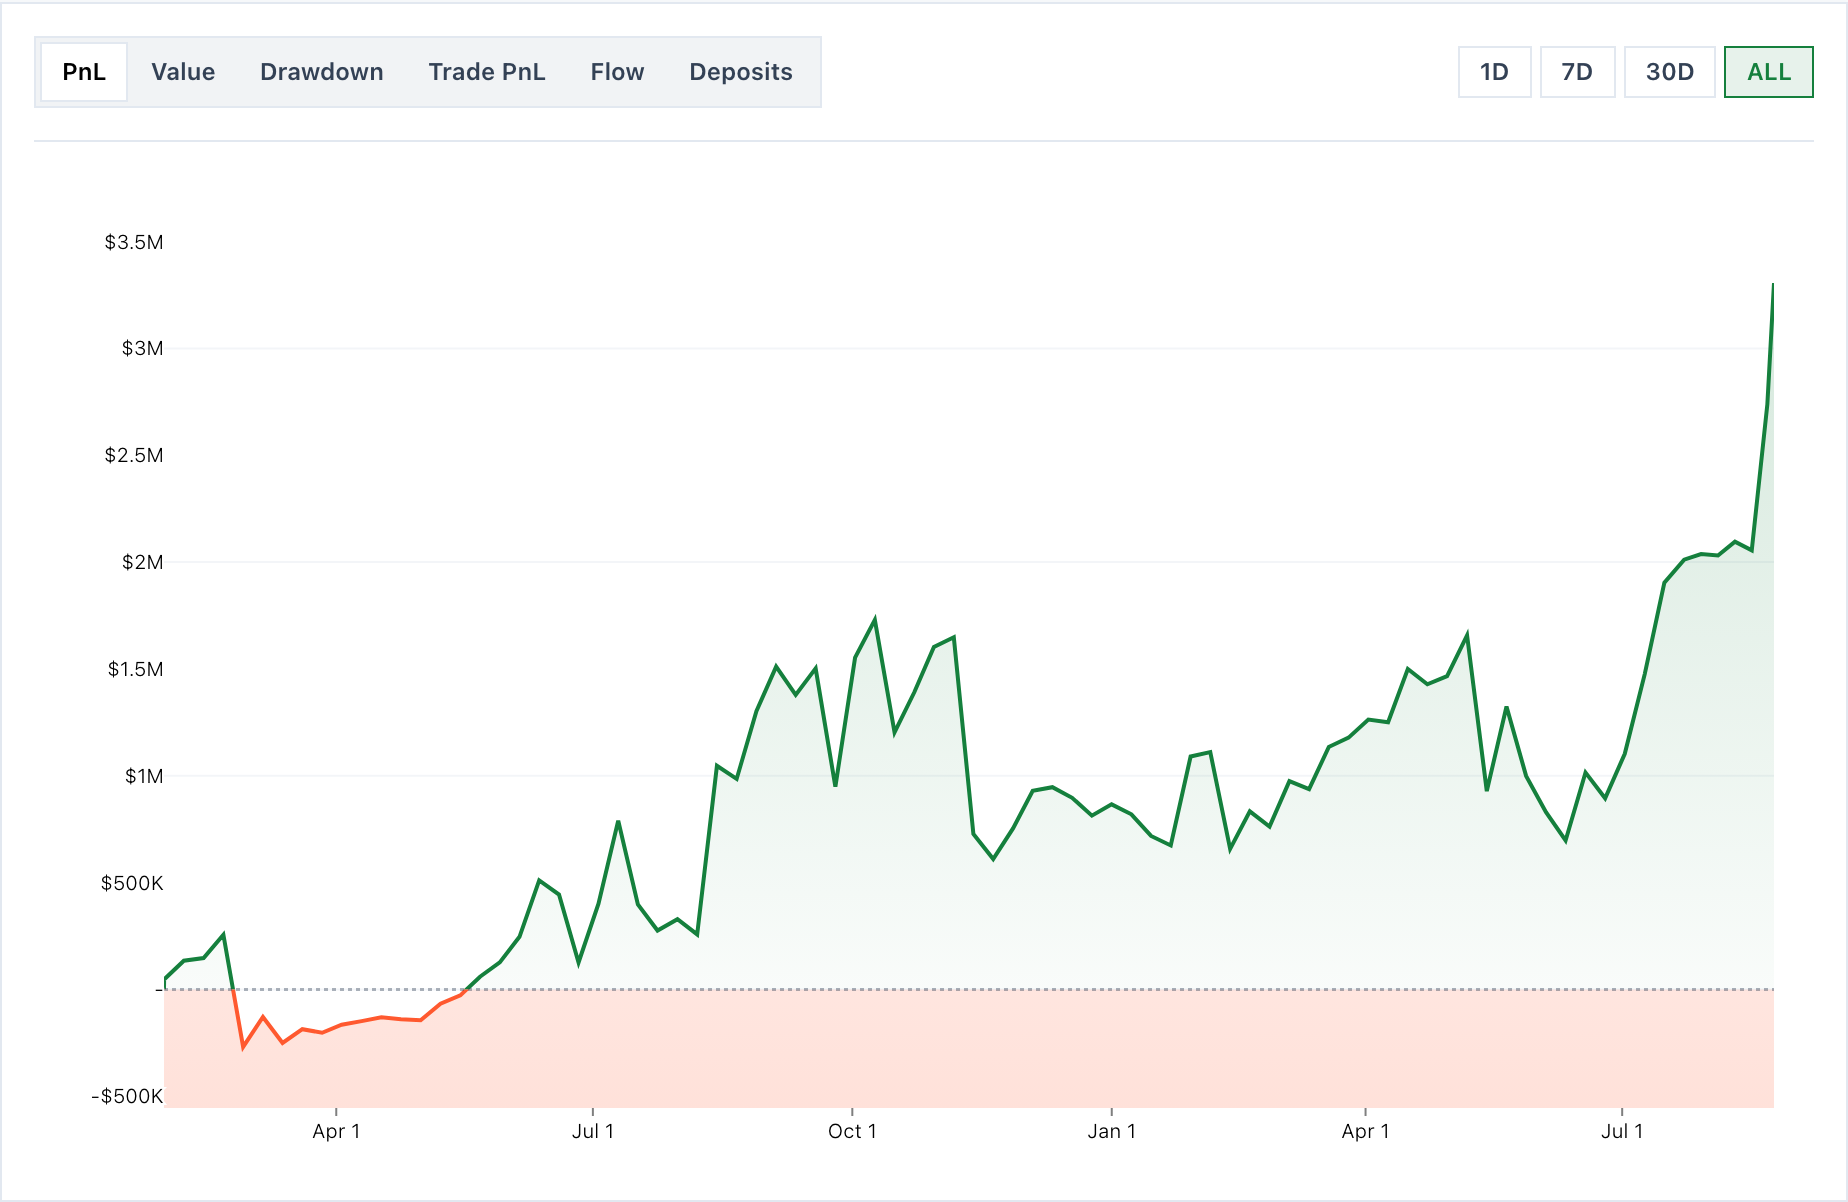
Section titled “Why use the charts?”Charts reveal what KPIs flatten into a single number — the shape of performance over time.
Six chart types are available through the selector. Each is designed to highlight a different dimension of vault behavior.
| Chart | What it reveals |
|---|---|
| PnL | Profit and loss trajectory. Look for consistency, not just total return. |
| Account Value | The vault’s equity curve. Smooth growth with minor pullbacks is generally preferable to a volatile equity line. |
| Drawdown | How deep and how long losses persist. Frequent or prolonged drawdowns signal poor risk management. |
| Trade Activity | Fills plotted as scatter or bars. Shows execution frequency and size distribution. |
| Net Flow | Cumulative deposit and withdrawal activity. Positive flow suggests depositor confidence; sharp reversals warrant attention. |
| Deposits | Daily deposit and withdrawal volumes as bars. Useful for identifying large individual capital events. |
When to use each one. Start with PnL and Account Value to understand the broad story. If you see large drawdowns, switch to the Drawdown chart. If you suspect capital instability, look at Net Flow and Deposits.
Timeframe selection
Section titled “Timeframe selection”Each chart supports four timeframes: 1D, 7D, 30D, and All.
Use 1D to inspect recent activity. Use 30D or All to evaluate consistency. No single timeframe tells the whole story — toggle between them.
Cards below the charts
Section titled “Cards below the charts”Four summary cards sit below the chart panel. These pull together information that’s useful at a glance but doesn’t fit into a KPI or a chart.
- My Position — Shows your equity, PnL, and lockup status in this vault. Only populated when your wallet is connected and you have an active deposit.
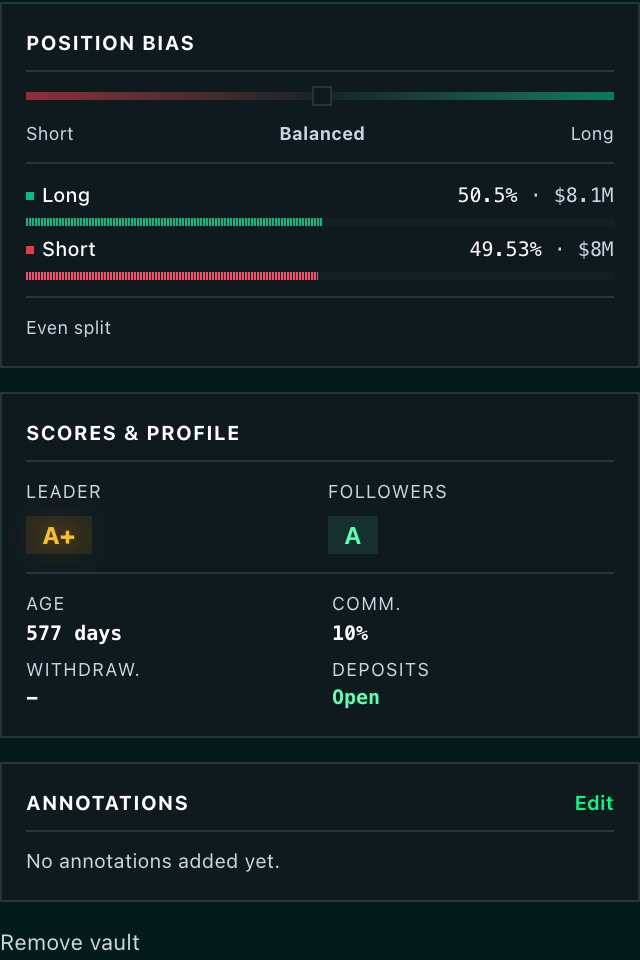
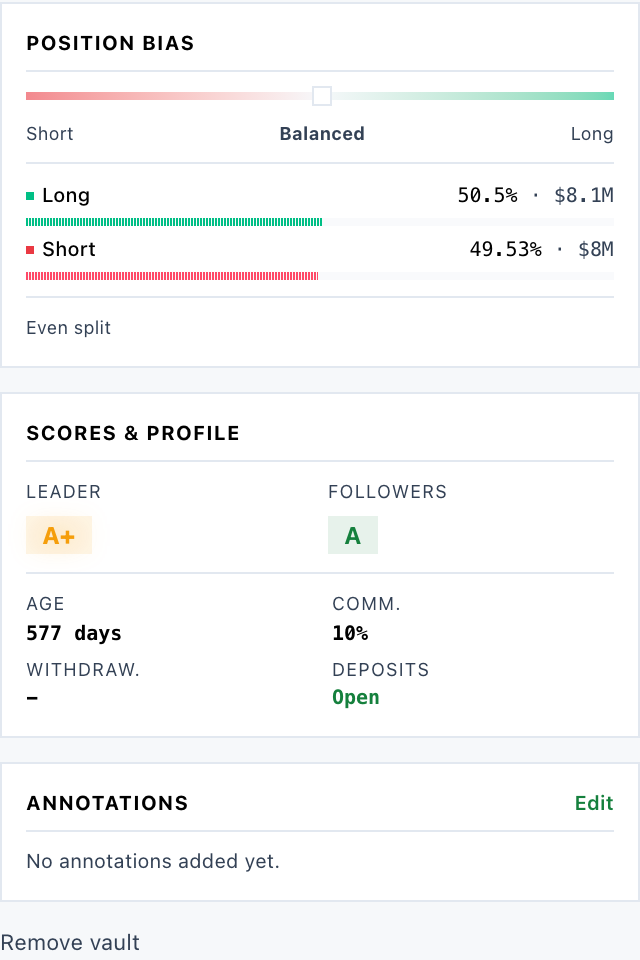
- Position Bias — The net directional bias of the vault’s open positions, calculated from the long/short equity split. Tells you whether the leader is currently bullish, bearish, or neutral.
- Scores Profile — Displays the vault’s LP (Leader Performance) and DP (Depositor Performance) grades, the leader’s commission rate, and the current deposit status. A quick way to assess overall quality without jumping to the reference docs.
- Annotations — A personal note area tied to this vault. Notes are stored locally and visible only to you. Use this to record observations, thesis points, or follow-up questions.